To provide superior growth for investors
Most Americans have discovered how difficult it is to find appropriate investment opportunities for achieving their long-term financial goals. Typically, their default solution is a traditional stock and bond portfolio—most often in the form of publicly available mutual funds. Sadly, this heavily diversified buy-and-hold approach often fails to provide returns that are robust enough to compound into sufficient wealth by the time investors need to draw on their assets.
We founded FIZYX Investment Group to help fill this void and provide a level of investment return commensurate with real-world long-term needs.
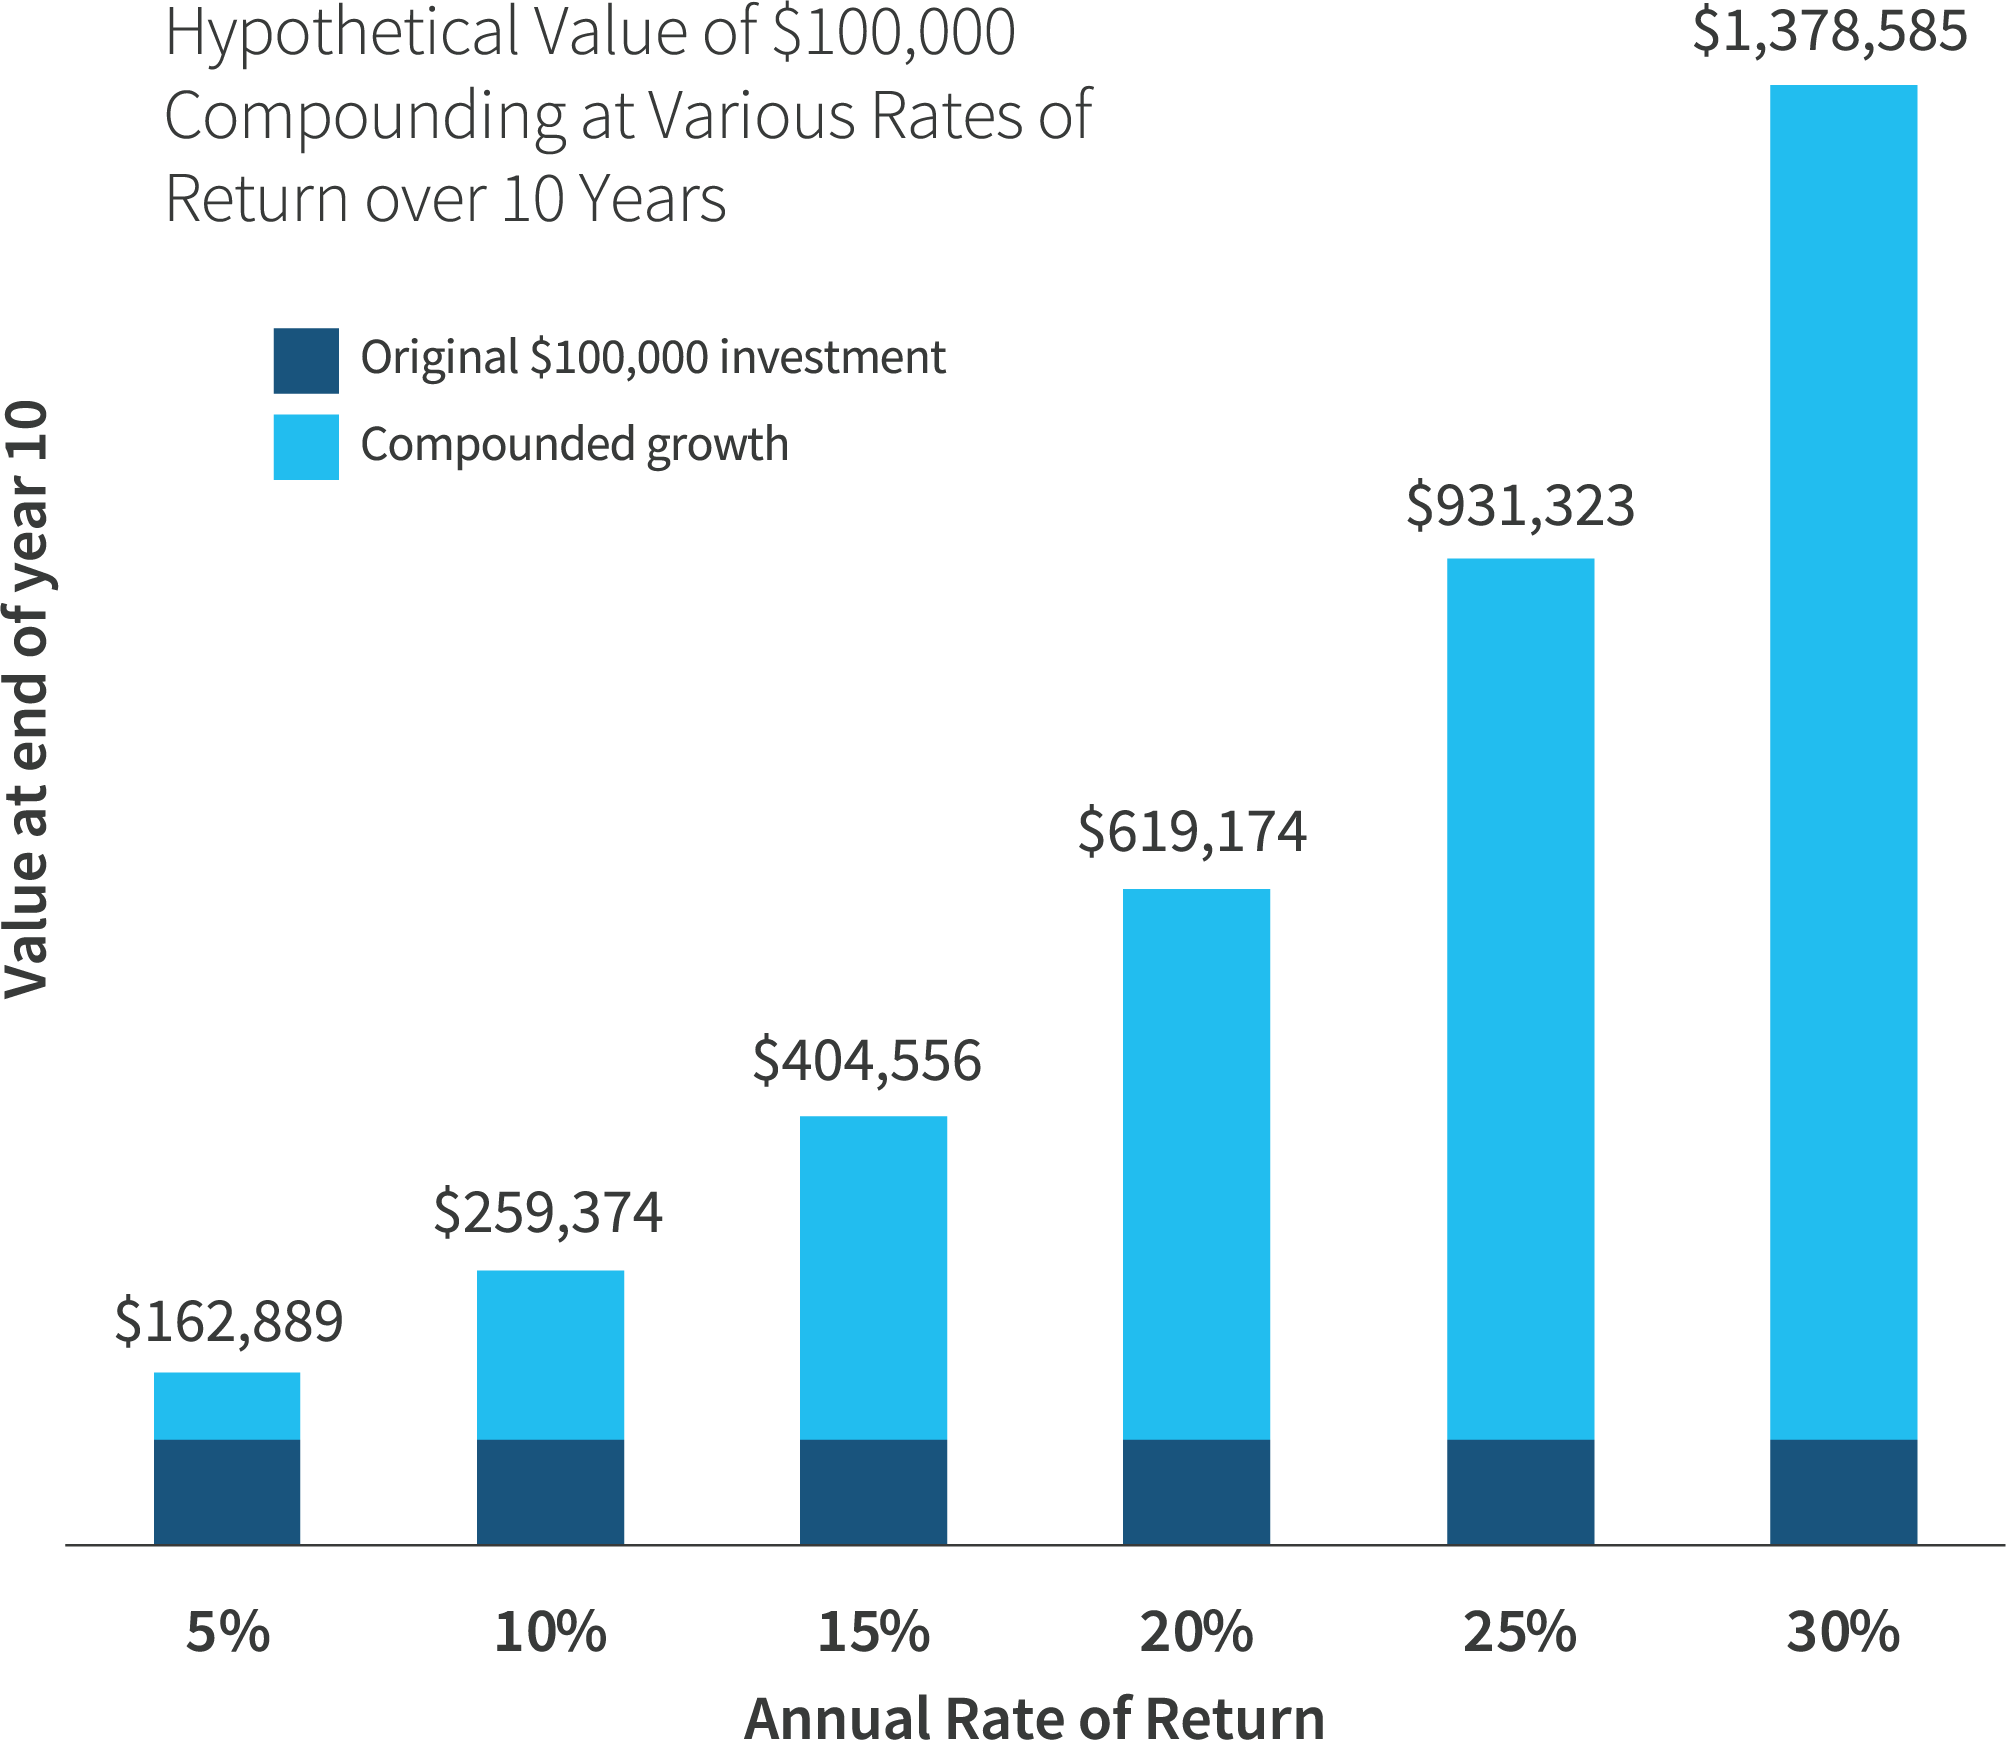
At the core of our vision is the principle: Any given increase in an investor’s annual rate of return will generally have a disproportionately large, positive effect on their compounded growth over time. We strive to capitalize on this principle.

As the hypothetical annual rate of return under consideration in this example is increased by increments of 5%, each increase would produce a disproportionately positive effect on the total growth over a period of ten years. What’s more, this effect is strikingly more pronounced on the right side of the chart, where higher annual rates of return are considered.
This chart is presented for conceptual purposes only and does not reflect the performance of any fund or account traded by FIZYX. There can be no guarantee that the rates of return shown are attainable.
FIZYX has created a high-octane growth discipline with a concentrated stock portfolio designed to generate superior alpha and rates of return. In doing so, we’ve validated our core concept:
A stock portfolio could grow exponentially by investing exclusively in companies that are themselves growing at exponential rates.
Alibaba
Amazon
Apple
Baidu
Blackberry
Canopy Growth
Celgene
Chipotle
Ebay
Genentech
Keurig
Monster Energy
Netflix
Nvidia
Priceline
Tesla
Tilray
Alibaba
Amazon
Apple
Baidu
Blackberry
Canopy Growth
Celgene
Chipotle
Ebay
Genentech
Keurig
Monster Energy
Netflix
Nvidia
Priceline
Tesla
Tilray
Email: in**@fi***.com